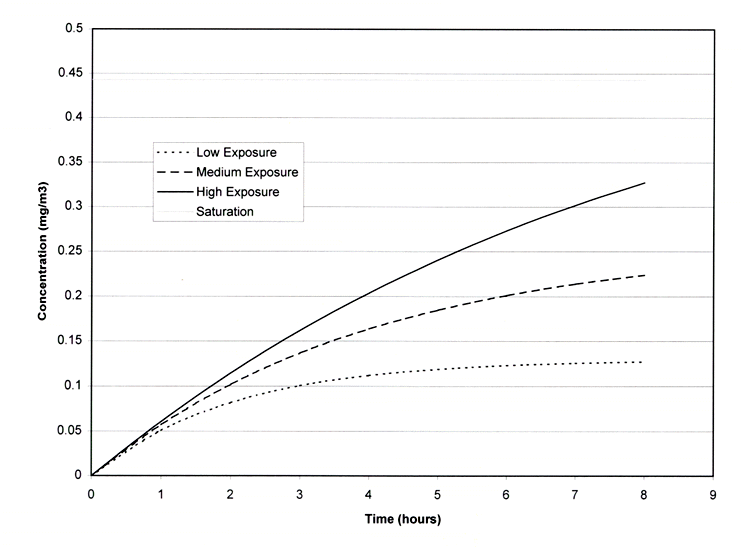
Figure 11. Time plot of methomyl concentrations in tanks
| First Page | Prev Page | Next Page | Back to Text |